Generator Site Dashboard
The Site Dashboard is the central monitoring hub for any single installation. It provides a quick glance at the status of all system components (generator, grid, and network) and serves as the navigation center for site-specific administrative tasks.
🏠Primary Dashboard View
The primary screen displays high-level status tiles that offer an immediate visual check of the system’s health.
Figure 1
Site Dashboard Screen
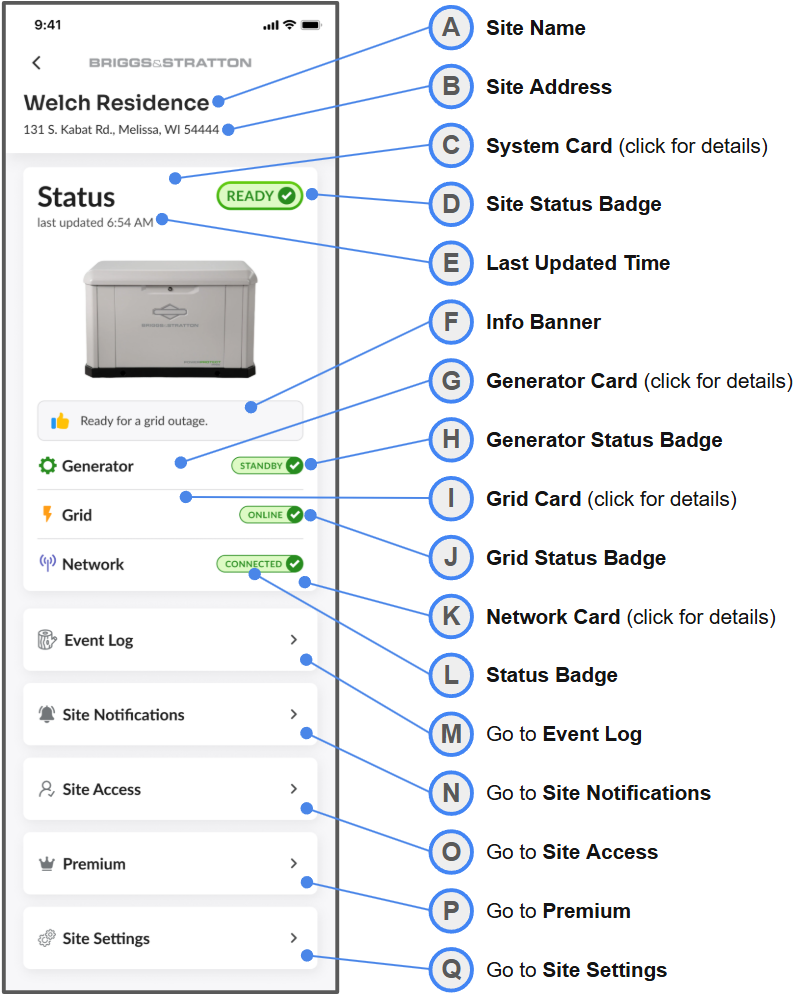
Table 1
Site Dashboard Elements
| ID | Screen Element | Description |
|---|---|---|
| A | Site Name | Unique, user-defined name for the site. This can be edited in Site Settings. |
| B | Site Address | The physical location of the system. This can be edited in Site Settings. |
| C | System Card | Clickable element containing system-level information, details. |
| D | Site Status Badge | An illustrated, top-level status of the entire system. |
| E | Last Updated Time | Time since the EnergyTrak device last sent a data packet to the app. |
| F | Info Banner | A brief description of the current top-level site state. |
| G | Generator Card | Clickable card containing generator information, details. |
| H | Generator Status Badge | Illustrated generator status badge. |
| I | Grid Card | Clickable card containing grid information, details. |
| J | Grid Status Badge | Illustrated grid status badge. |
| K | Network Card | Clickable card containing network information, details. |
| L | Status Badge | Illustrated network status badge. |
| M | Go to Event Log | Click to open the site’s Event Log. |
| N | Go to Site Notifications | Click to open the user’s site-level notifications settings. |
| O | Go to Site Access | Click to open the site’s user access permissions. |
| P | Go to Subscriptions | Click to open the site’s Premium feature status, settings. |
| Q | Go to Site Settings | Click to open the Site Settings menu. |
🚦Understanding Site States
The systems overall health is represented by the Site Status Badge and explained in the Info Banner. Here are the key statuses depicted:
Table 2
Site State Descriptions
| Site State | Description |
|---|---|
| Ready | The generator is in Standby, the grid is Online, and the network is Connected. Your system is healthy and ready to power your site in a grid outage. |
| Running | The utility grid is offline, and your generator is actively running and powering the site. |
| Exercising | The generator is running a scheduled or manual test while the utility grid is still online. |
| Warning | Indicates a non-critical issue, such as a network connectivity problem, even if the generator is healthy. |
| Fault | An active fault has been detected. |
| Disconnected | The EnergyTrak device has lost its connection to the network. |
| Deactivated | The site has been intentionally set as inactive. |
| Ready For Setup | The site has been created and is ready for device setup. |
For complete details on equipment health statuses and site impact, please see the Site Health and State System page
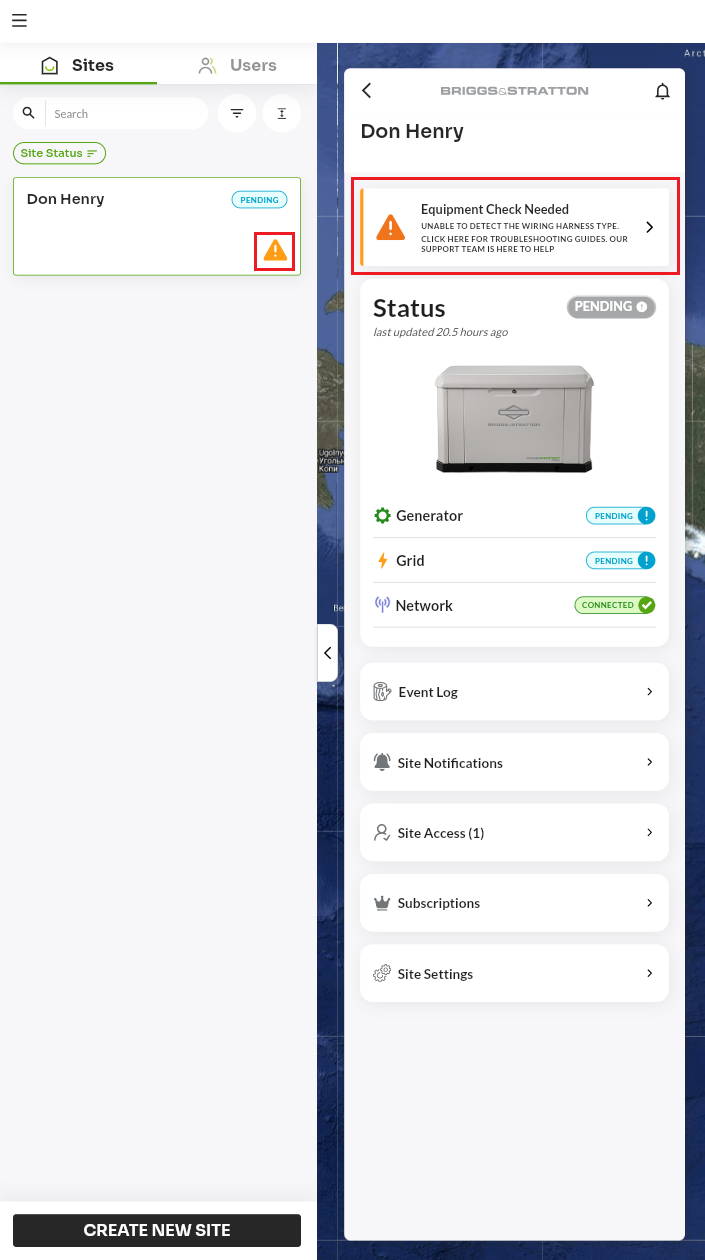
Equipment Malfunction Alerts
Devices that have detected equipment issues will display visual indicators to alert you of the malfunction. These indicators will appear in two primary locations:
- Sites List: An orange caution icon (⚠️) displayed next to the site name in the Sites List.
- Site Dashboard: A prominent "Equipment Check Needed" banner at the top of the Site Dashboard screen.
Tapping the banner within the Site Dashboard will immediately redirect you to the relevant troubleshooting guide or support documentation for the error detected. The banner monitors the system in real-time and will automatically disappear once the malfunction is resolved.
🛠️ Details in the Subsystem Drawers
Clicking on the Site, Generator, Grid, or Network cards opens a bottom drawer with detailed status information.
Figure 2
Site Details Bottom Drawer
Access: Tap the Site Status Badge (C) from the Primary Site Dashboard to open this screen.
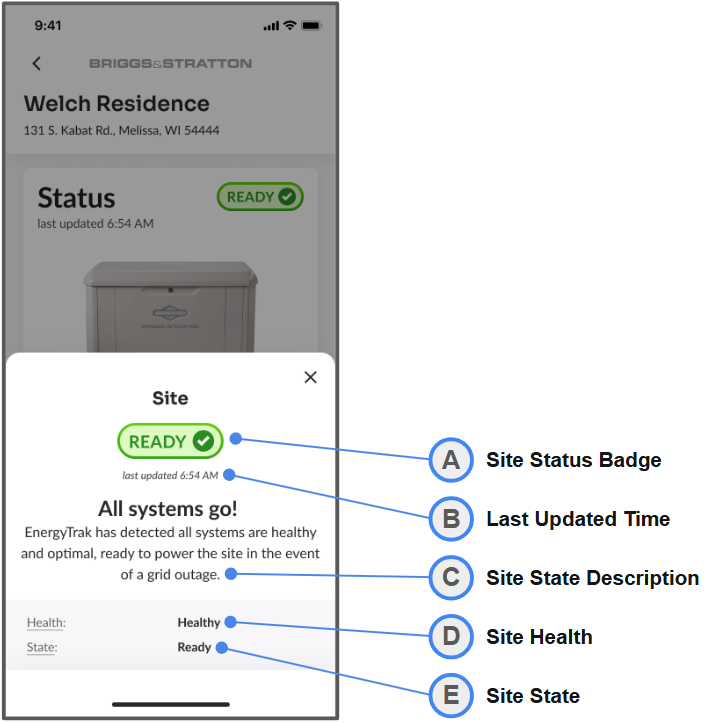
Table 3
Site Details Field Descriptons
| ID | Description |
|---|---|
| A | Illustrated site status. |
| B | Time since last EnergyTrak device data packet transmission. |
| C | Detailed description of the current site state. |
| D | Top-level system functional status. This refers to the system's operational condition (e.g., Healthy, Warning, Critical, Disconnected, etc.) |
| E | Top-level system operating status. This describes what the system is doing (Ready, Exercising, Running, Warning, etc.) |
Figure 3
Generator Details Bottom Drawer
Access: Tap the Generator Card (G) from the Primary Site Dashboard to open this screen.
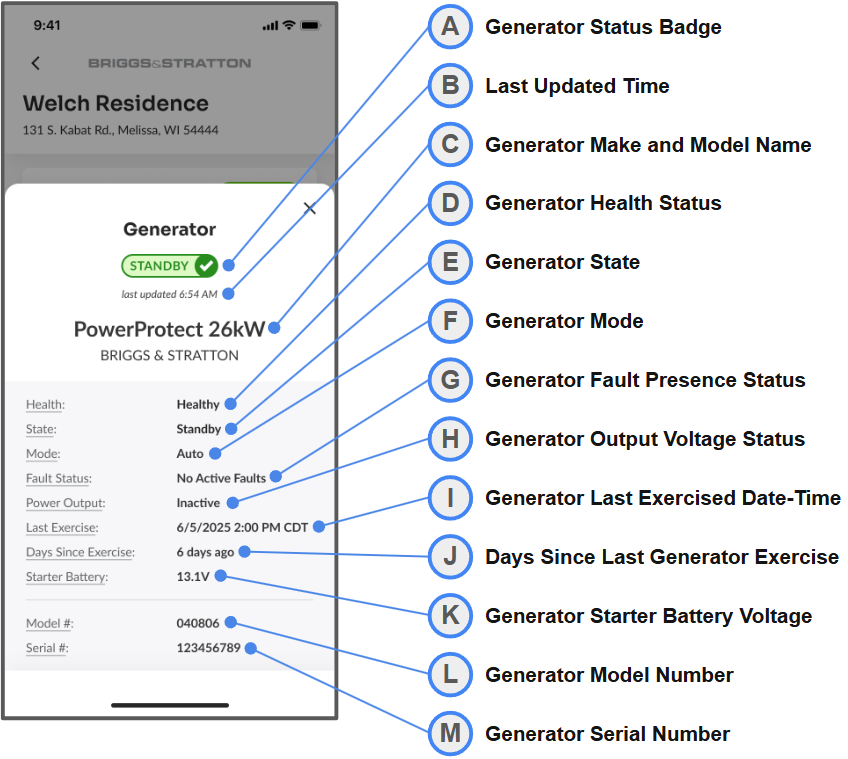
Table 4
Generator Details Field Descriptions
| ID | Description |
|---|---|
| A | Illustrated generator status. |
| B | Time since last EnergyTrak device data packet transmission. |
| C | Global manufacturer name and model name of the generator. |
| D | Generator functional status. |
| E | Generator operating status. |
| F | Generator operating mode, Auto or Manual. |
| G | Presence of an active fault on the generator controller. |
| H | Presence of voltage on the generator output sensor. |
| I | Date and time of the last detected generator exercise. |
| J | Days since the last detected generator exercise. |
| K | Voltage of the generator’s starter battery. |
| L | Model number of the installed generator. |
| M | Serial number of the installed generator. |
Figure 4
Grid Details Bottom Drawer
Access: Tap the Grid Card (I) from the Primary Site Dashboard to open this screen.
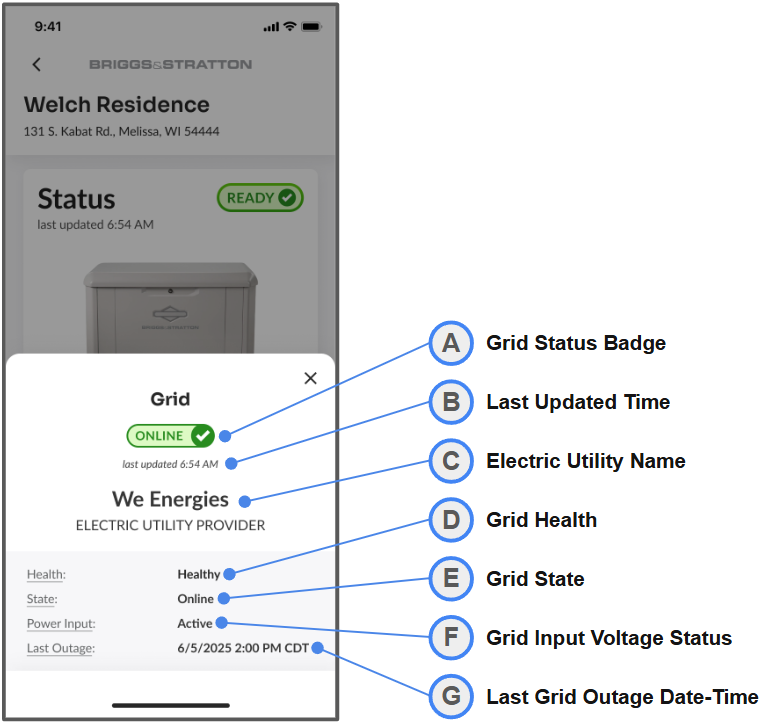
Table 5
Grid Details Field Descriptions
| ID | Description |
|---|---|
| A | Illustrated grid status. |
| B | Time since last EnergyTrak device data packet transmission. |
| C | Global name of the electric utility service provider. |
| D | Grid functional status. |
| E | Grid operating status. |
| F | Presence of voltage on the utility input sensor. |
| G | Date and time of the last detected grid outage. |
Figure 5
Network Details Bottom Drawer
Access: Tap the Network Card (K) from the Primary Site Dashboard to open this screen.
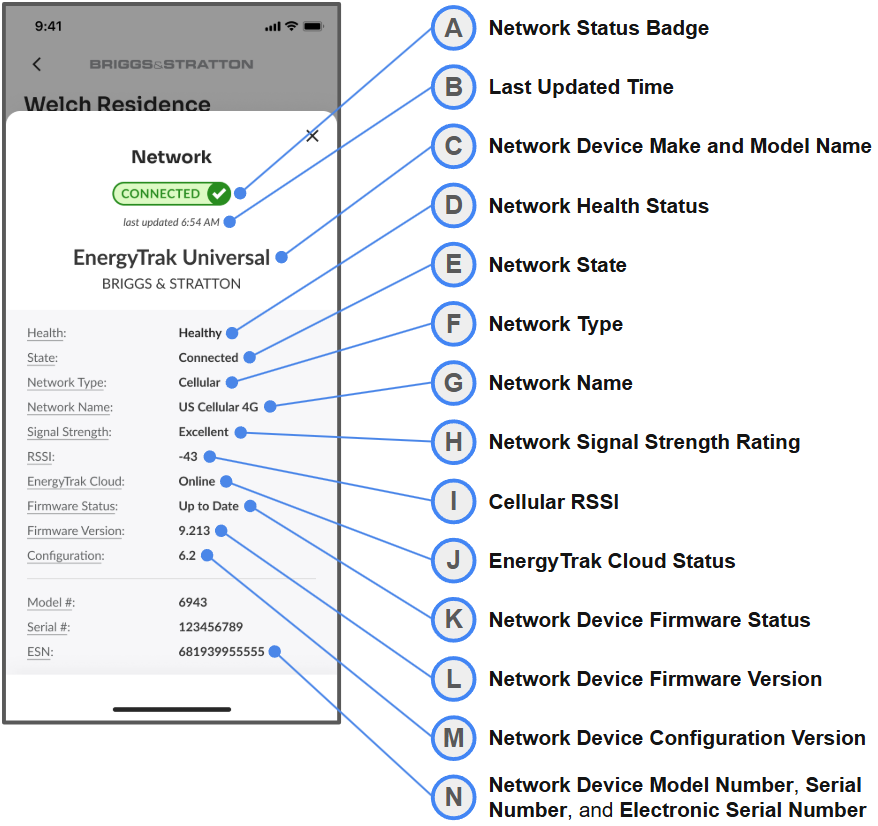
Table 6
Network Details Field Descriptions
| ID | Description |
|---|---|
| A | Illustrated network status. |
| B | Time since last EnergyTrak device data packet transmission. |
| C | Manufacturer name and model name of the network device. |
| D | Network functional status. |
| E | Network operating status. |
| F | Network type of the primary network. |
| G | Name of the primary network. |
| H | Rated network signal strength. |
| I | Measured received signal strength indicator (RSSI). |
| J | Operating status of the EnergyTrak platform. |
| K | Update status of the network device firmware. |
| L | Current network device firmware version. |
| M | Current network device configuration version. |
| N1 | Model number of the installed network device. |
| N2 | Serial number of the installed network device. |
| N3 | Electronic serial number (ESN) of the installed network device. |
| O | Run command to request a response from the network device. |
| P | Run command to request the network device to reboot. |