Event Log
From the Site Dashboard screen, users can access the Event Log. This feature provides users with important historical information about their site and system in an organized list, including information related to faults, warnings, firmware updates, and other important events.
What is the Event Log?
The Event Log serves as a historical timeline of your system. While Notifications (see Notifications page) are real-time alerts designed for immediate action, the Event Log contains every single event—including minor status changes, user commands, network updates, and resolutions—often going back months.
Accessing the Event Log
The Event Log can be accessed through a specific navigation path:
- View Sites: From the main application view, navigate to the Sites List.
- Select Site: Click into the specific site you want to view.
- Site Dashboard: From the Site Dashboard, scroll down and click the Event Log tab to open the site's historical log.
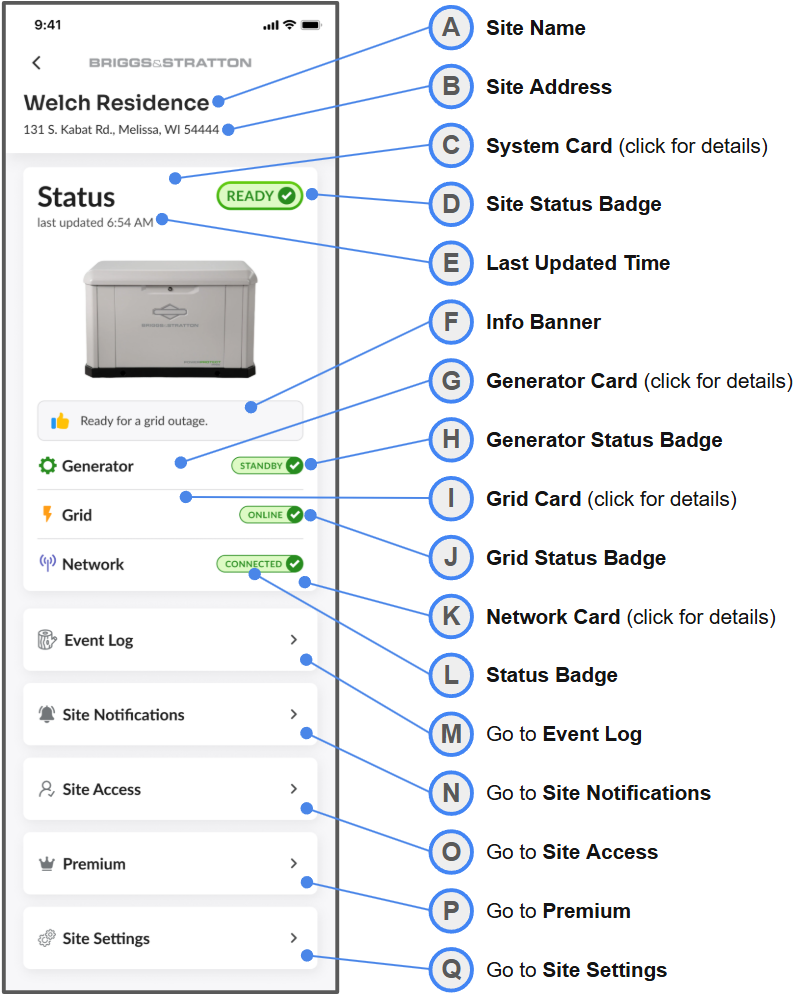
Figure 1
Accessing the Event Log
Access: Tap the Event Log tab (M) from the Primary Site Dashboard to open this screen.
Navigating the Event Log
Upon opening the Event Log, the system status and currently viewed date range are displayed. The date range can be adjusted to view the events for a specific historical period.
The Event Log can be easily filtered to locate key events. Filtering options allow viewing events by:
- Categories: Filter by Health Status, Equipment, Network, System Update and Generator Monitoring.
- Log Levels: Filter by the technical log levels (Info, Trace, Warning, Error).
The log can also be sorted by time/date (descending or ascending), severity, and category.
Viewing Event Details
Clicking on any event in the log displays a short description of the given event. Users can also click the Help button within the event detail to be redirected to the dedicated support tab within the EnergyTrak app.
Understanding Event Log Entries
Each entry in the Event Log includes several data points related to the event, including date and time of original detection as well as the event name.
| Event Title | Description | Event Pill Status |
|---|---|---|
| Reset Event | The EnergyTrak device has restarted or rebooted. | Info |
| Network Connection Established | The device has successfully connected to the cellular network. | Info |
| Network Time Sync Request | The device is checking in with the OTA server to ensure its internal time clock is accurate. | Info |
| Update Completed (Pending Reset) | A configuration or firmware update has been downloaded and is waiting for the device to restart to apply it. | Info |
| Heartbeat | A routine, automated check-in message sent by the device to the cloud server to confirm connectivity. This message is sent out on 3 intervals depending on inputs and control flags: 1 Hour, 5 Minutes, 5 Seconds. | Info |
| Ping (raw) | The device received a manual diagnostic command (via SMS) to report its status. | Info |
| Generator Sense Active | The generator has been sensed as on. | Info |
| Generator Sense Inactive | The generator has been sensed as off or stopped. | Info |
| Fault | A fault has been detected. | Critical |
| Fault Cleared | The previously detected generator fault condition has been resolved or cleared. | Info |
| Utility Sense Active | Incoming power from the utility grid has been detected and is online. | Info |
| Utility Sense Inactive | Incoming power from the utility grid is no longer detected and is offline. | Info |
| Module Battery Disconnected | The internal module battery has been disconnected. | Warning |
| Module Battery Connected | The internal module battery is connected. | Info |
| Generator Battery Voltage Normal | The generator’s battery voltage is above 9V. | Info |
| Generator Battery Voltage Low | The generator’s battery voltage is below 9V. | Warning |
| Transfer Switch High | The transfer switch voltage (XFER) is above 9V | Info |
| Transfer Switch Low | The transfer switch voltage (XFER) is below 9V. | Info |
| Enable Output 1 ACK | A remote start command sent from the app has been acknowledged by the generator. | Info |
| Output 1 Already Active NAK | A remote start command failed because the generator was already running. | Info |
| Disable Output 1 ACK | A remote stop command sent from the app has been acknowledged by the generator. | Info |
| Output 1 Already Inactive NAK | A remote stop command failed because the generator was already stopped. | Info |
| Pulse Output 1 ACK | A remote fault clear command sent from the app has been acknowledged by the generator. | Info |
| User Viewing Site ACK | The device received a command to output messages every 5 seconds for 120 seconds. | Info |
| User Viewing Site Timeout ACK | The 120-second period for rapid status updates (User Viewing Site) is complete. | Info |
| Smart Mode Detection - Manual | Smart Mode (if enabled) detected the generator has been manually switched on. | Info |
| Smart Mode Detection - Auto | Smart Mode (if enabled) detected the generator is in auto mode. | Info |
| Smart Mode Detection - Fault | Smart Mode (if enabled) detected a generator fault. | Critical |
| Ping | The device was sent a command from the app to report its current status. | Info |
| Reset Request ACK | A reset command sent from the app has been acknowledged by the device. | Info |
| OTA Server Check-In ACK | The device acknowledged a command from the app to check in to the OTA server. | Info |
| Enable Smart Mode ACK | The command to enable Smart Mode has been successfully acknowledged by the device. | Info |
| Smart Mode Already Active NAK | The command to enable Smart Mode failed because Smart Mode is already active. | Info |
| Smart Mode Not Supported NAK | The command to enable Smart Mode failed because this generator model does not support Smart Mode. | Info |
| Disable Smart Mode ACK | The command to disable Smart Mode has been successfully acknowledged by the device. | Warning |
| Smart Mode Already Disabled NAK | The command to disable Smart Mode failed because Smart Mode was already disabled. | Info |
| User Not Viewing Site ACK | The system confirmed that the user is no longer actively viewing the site dashboard. | Info |
| Module Temperature Normal | The temperature of the module is within its normal operating range. | Info |
| Module Temperature High | The temperature of the module is above the normal operating range. | Warning |